


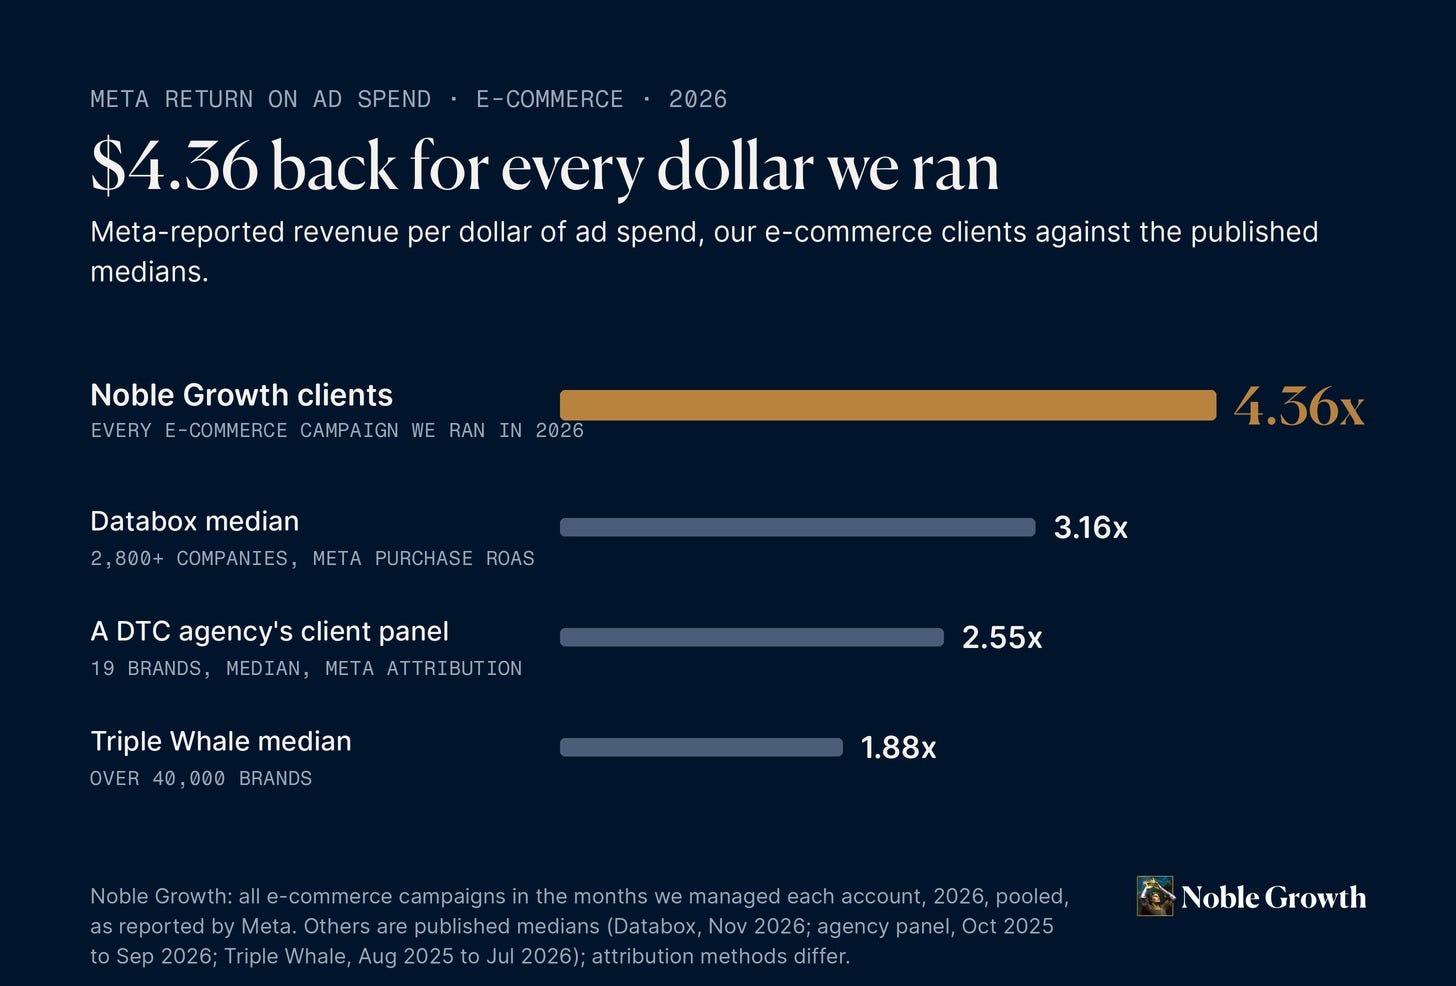
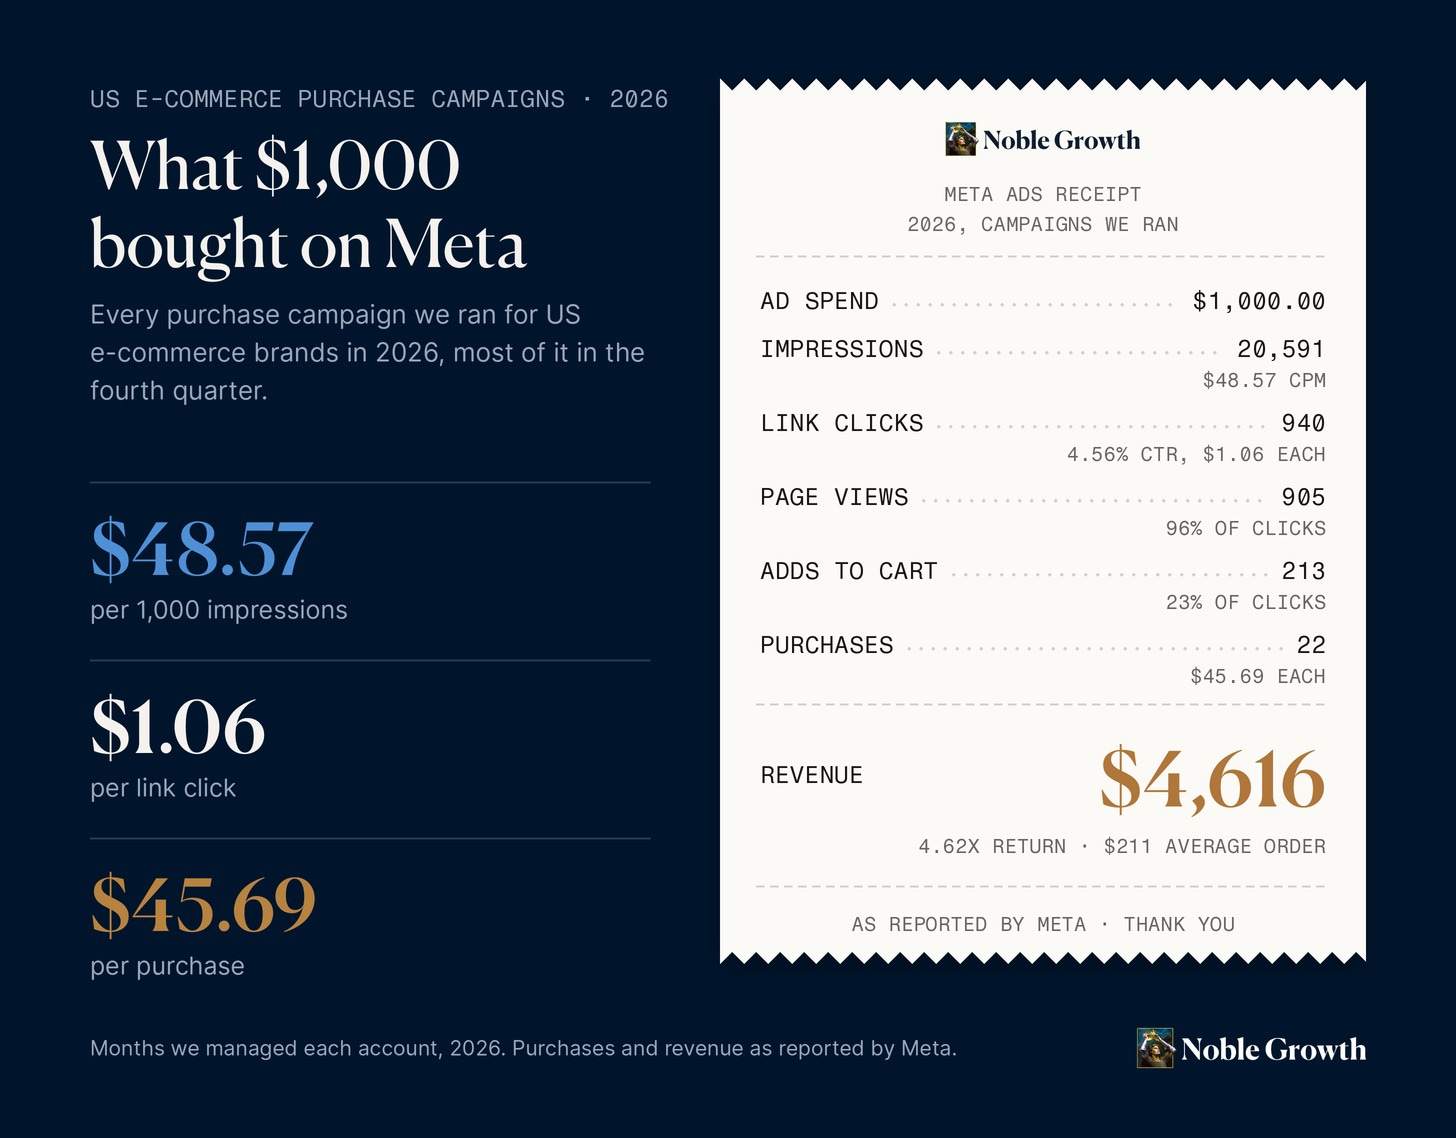
Every dollar we put into Meta ads for our e-commerce clients this year came back as $4.36 in tracked sales, more than twice the return of the median brand. For our US stores, those campaigns cost $48.57 per thousand impressions, $1.06 per click and $45.69 per purchase, on orders that averaged $211.
The numbers come from our own ad accounts: a six-figure budget, 8.4 million impressions and nearly 1,000 ads in 2026. Costs cover the full year. Sales and returns cover only the months we ran each account, after we confirmed Meta was counting purchases correctly.
The short version
Every e-commerce dollar we ran returned 4.36x. Published medians run from 1.88x to 3.16x.
US e-commerce purchase campaigns we ran, mostly in the fourth quarter: $48.57 CPM, $1.06 per click, $45.69 per purchase.
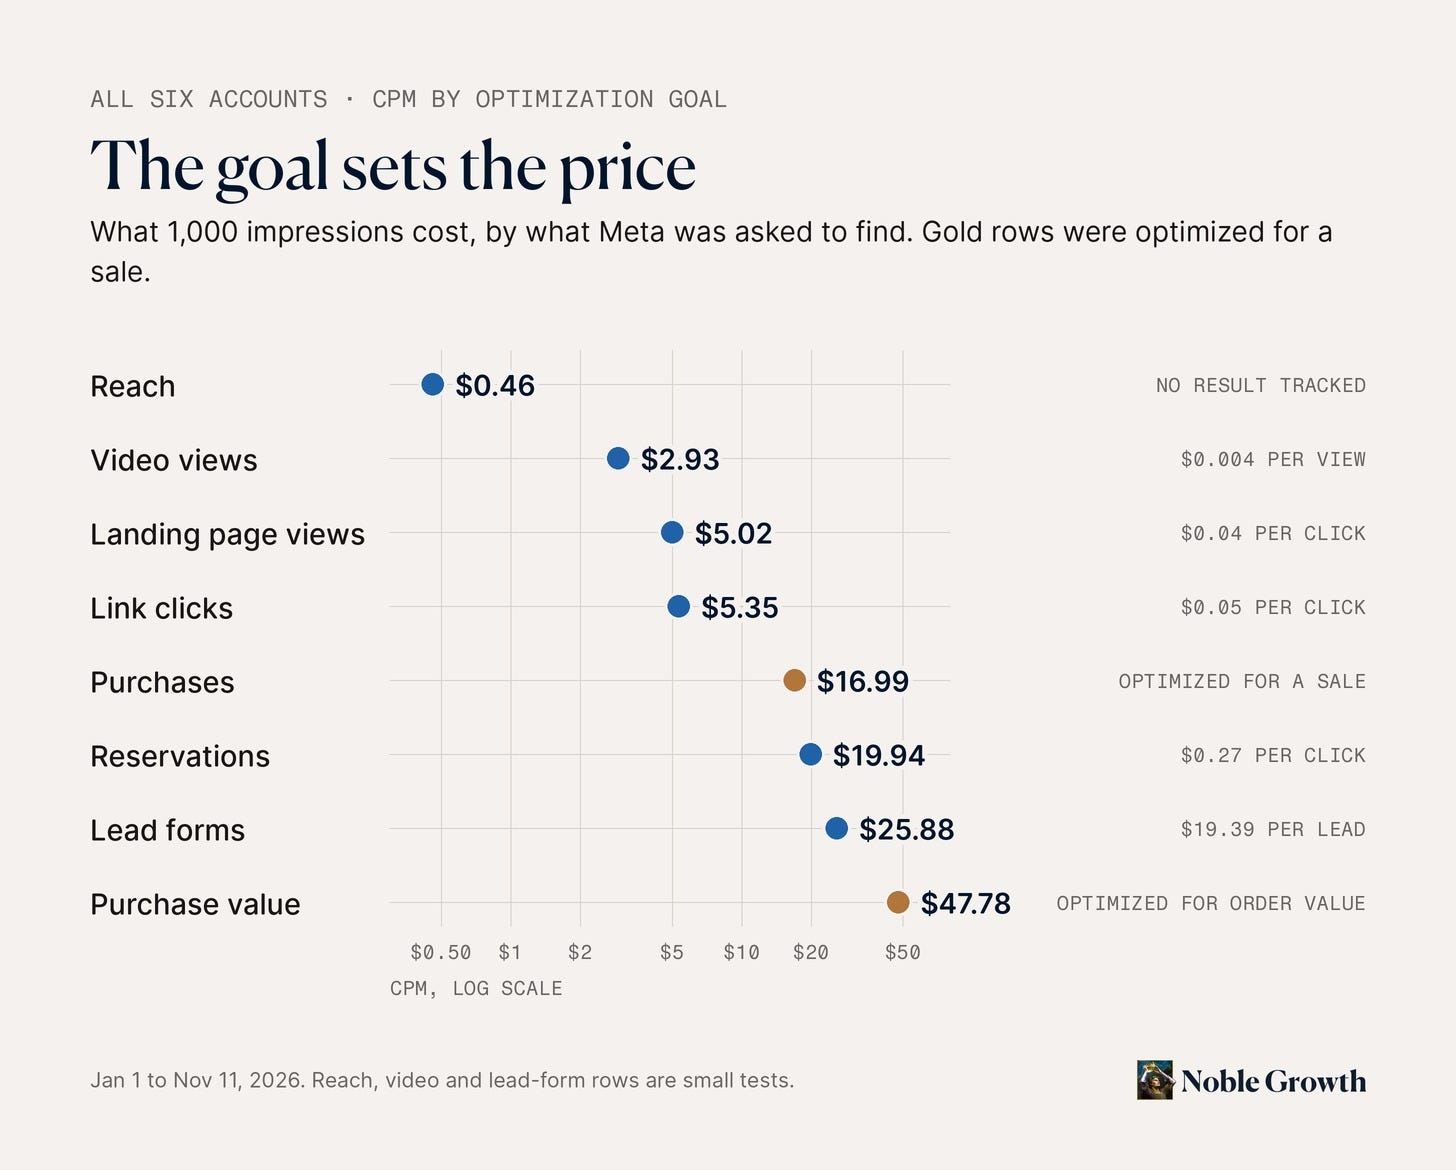
The goal sets the price: $0.46 per thousand impressions for reach, $47.78 for purchase value.
Older buyers cost more to reach and no more to win: every age group cost $44 to $49 per purchase.
One ad in ten produced 85% of purchases. Two thirds produced none.
What is a good ROAS for Meta ads?
Most agencies don't publish what their clients earn. The one agency client panel we could find reports a median of 2.55x across 19 brands. The large brand panels sit between 1.88x (Triple Whale, over 40,000 brands) and 3.16x (Databox, 2,800+ companies).
In the months we ran them, our e-commerce clients' Meta campaigns returned 4.36x: $4.36 in sales for every dollar, as Meta reports it. Our median client returned 3.44x, above every published median.
A good ROAS is one above your break-even, which is one divided by your contribution margin: at a 50% margin, anything over 2x makes money on the first order. The habits behind our number are below. If your account returns less, book an intro call and we will show you where the gap is.
How much do Meta ads cost in 2026?
For the US e-commerce purchase campaigns we ran, most of them in the fourth quarter: a $48.57 CPM, a 4.56% link click-through rate, $1.06 per click, a 2.33% click-to-purchase rate and $45.69 per purchase.
Across the full year, US e-commerce purchase campaigns paid $27.21 per thousand impressions, and every US account and goal together averaged $20.05. The fourth quarter costs more, as the weekly chart below shows.
How do Meta ad costs vary by industry?
Our three e-commerce brands' purchase campaigns paid $41.79 per thousand impressions and $50.60 per purchase together. Our international store paid about half the US price per thousand impressions and about twice as much per purchase, on orders that averaged $372 against $211. Our hospitality and media accounts, which mostly bought reservations and clicks, paid $10.92 per thousand impressions over the year. For other industries, our Meta ads benchmarks by industry page lists published medians for thirteen of them.
Why do some impressions cost 100 times more than others?
Meta sells ads in an auction, and the goal you choose sets the price. Reach campaigns bought 1,000 impressions for $0.46. Purchase-value campaigns paid $47.78 to reach people Meta expected to place large orders, and earned it: in one of our accounts they returned 5.40x, against 1.84x for campaigns optimized for the number of purchases.
Are cheap clicks a good sign?
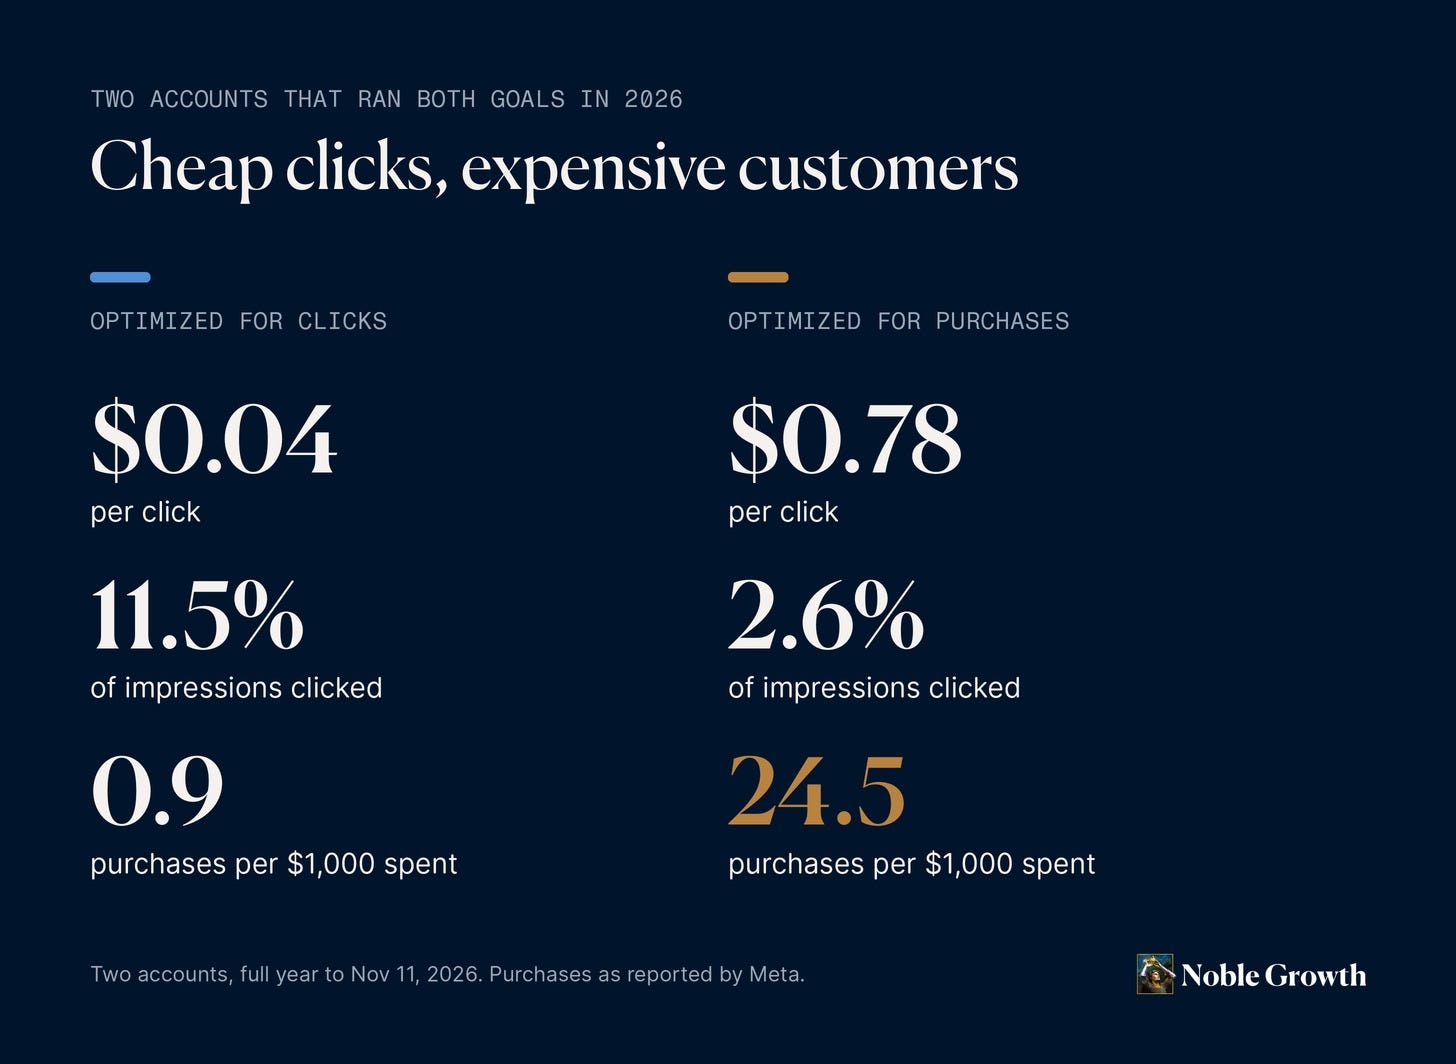
Rarely. Two of our accounts ran click campaigns and purchase campaigns in the same year. Optimized for clicks, they paid four cents a click and got 0.9 purchases per $1,000. Optimized for purchases, they paid $0.78 a click and got 24.5. Meta does what you ask: ask for clicks and it finds people who click.
Which audiences and placements are worth paying for?
Older buyers cost more to reach and no more to win. People under 35 cost $33.89 per thousand impressions and people 65 and older $52.83, yet every age group cost $44 to $49 per purchase. The Facebook feed bought the cheapest sales, at $40.27, and Instagram Stories the most expensive, at $60.63.
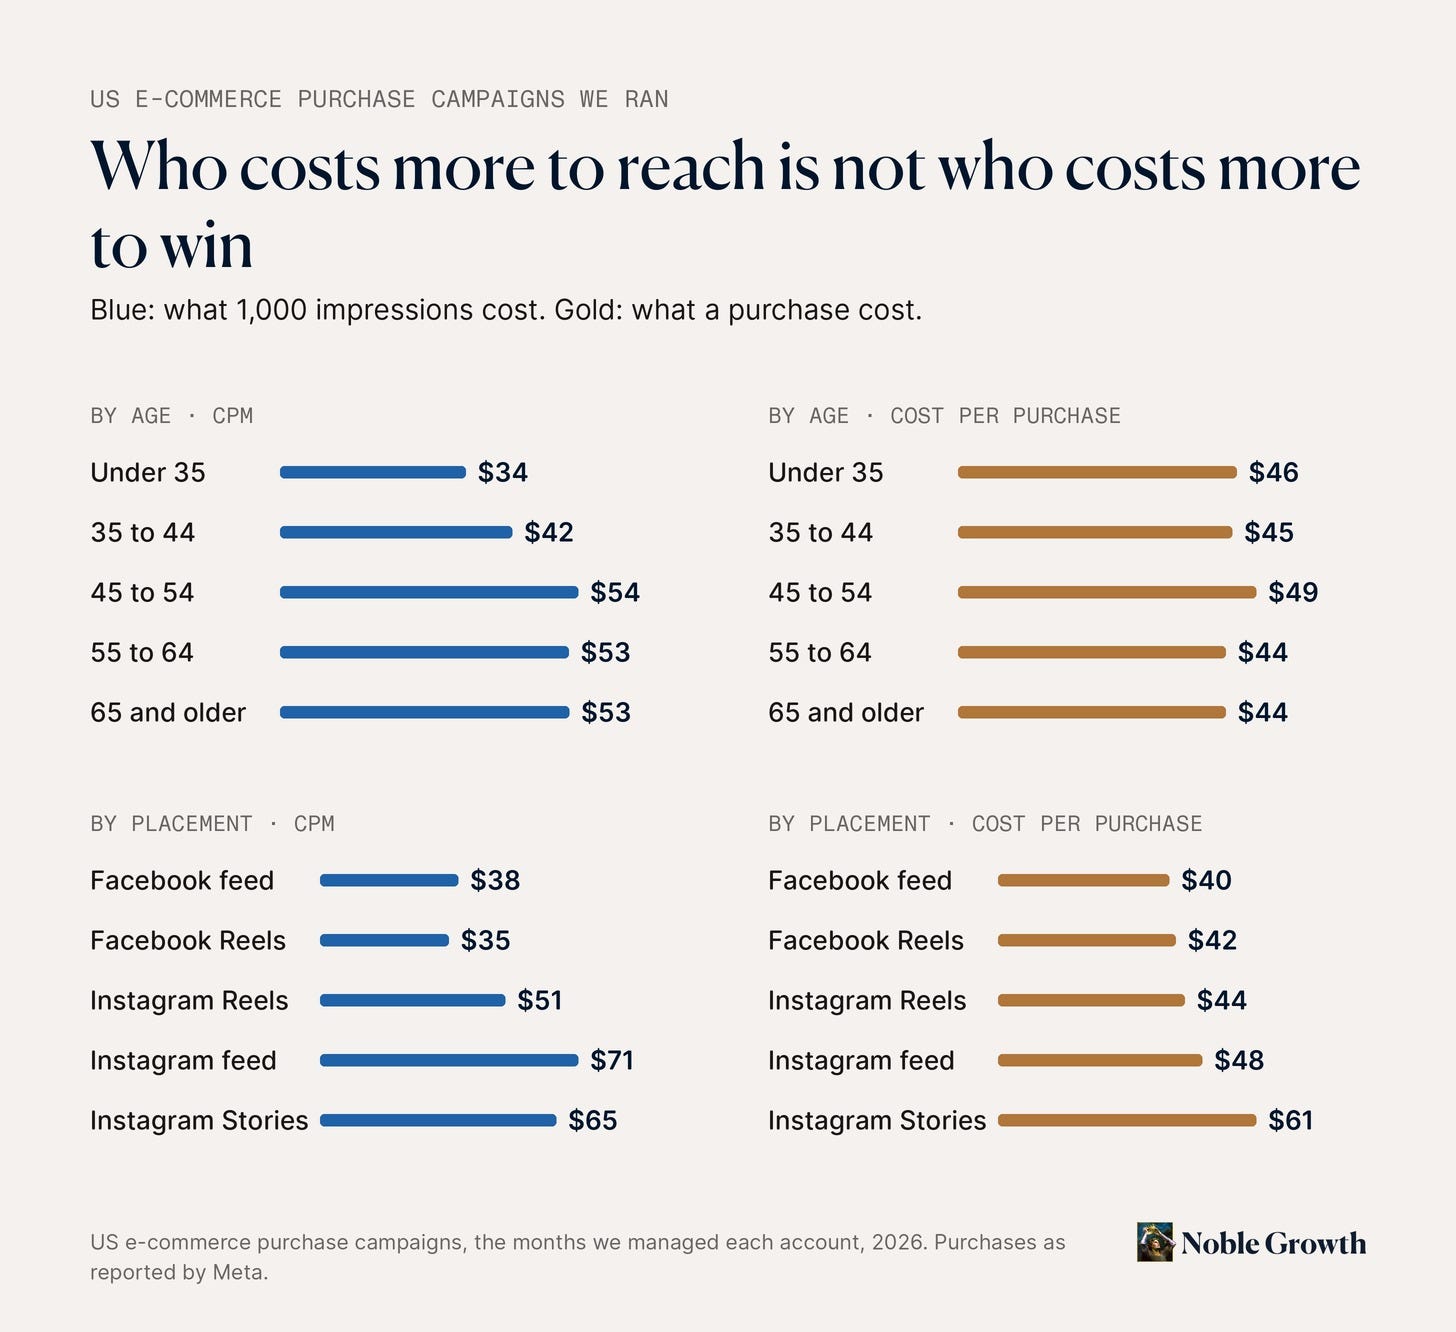
The takeaway: a CPM is a price. Judge an audience by what it costs to win a customer there.
Which Meta ad format works best?
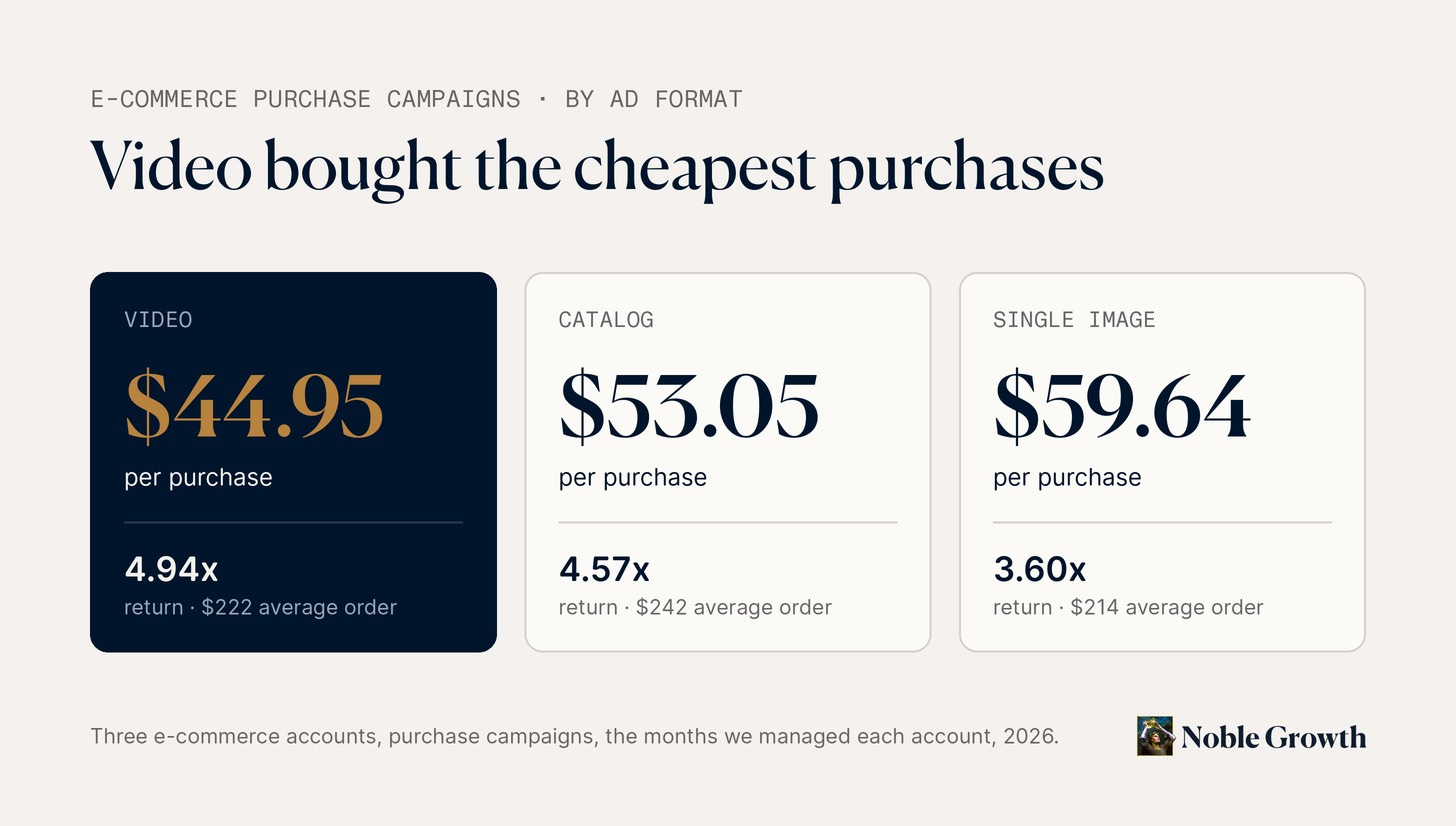
In the campaigns we ran, video bought the cheapest purchases: $44.95 at a 4.94x return, against $53.05 for catalog ads and $59.64 for single images.
How many ads does it take to find a winner?
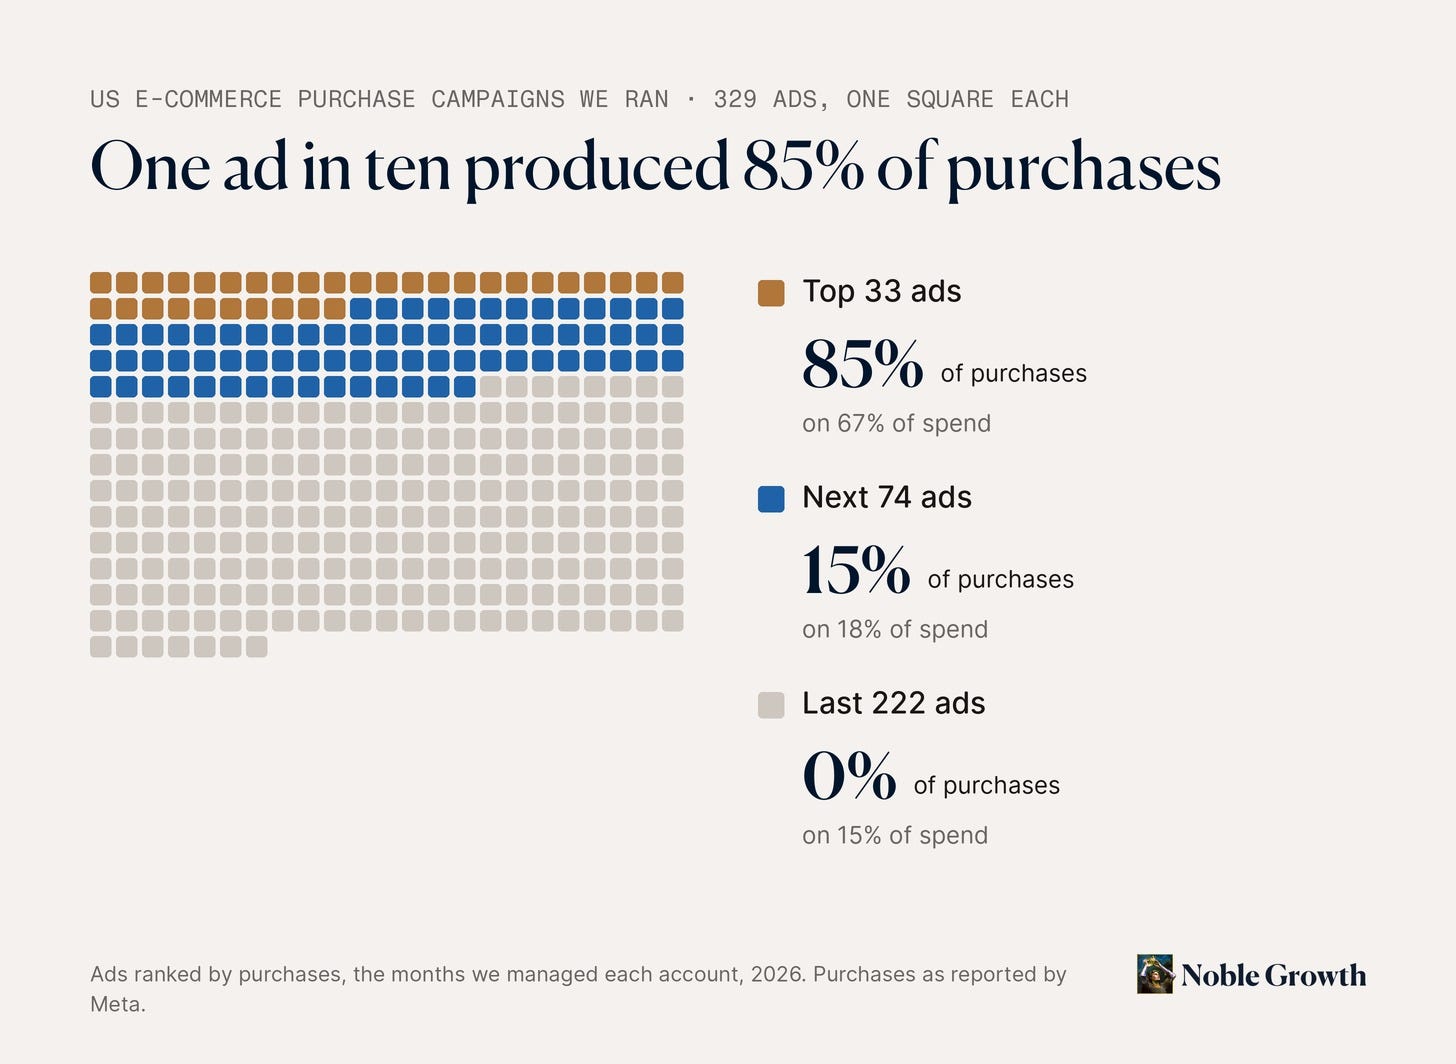
More than most plans allow for. Of 329 ads in our US purchase campaigns, the top tenth produced 85% of purchases. Two thirds produced none, on 15% of spend. Plan creative in batches and expect most of each batch to lose.
When do Meta ads get expensive?
Earlier than most budgets assume. One US brand's purchase-value campaigns paid $40.77 per thousand impressions in the week of September 10 and $59.72 in the week of November 5, before Black Friday. Cost per purchase rose only 12%, and that November week returned 6.86x, the best of the season, as shoppers arrived ready to buy.
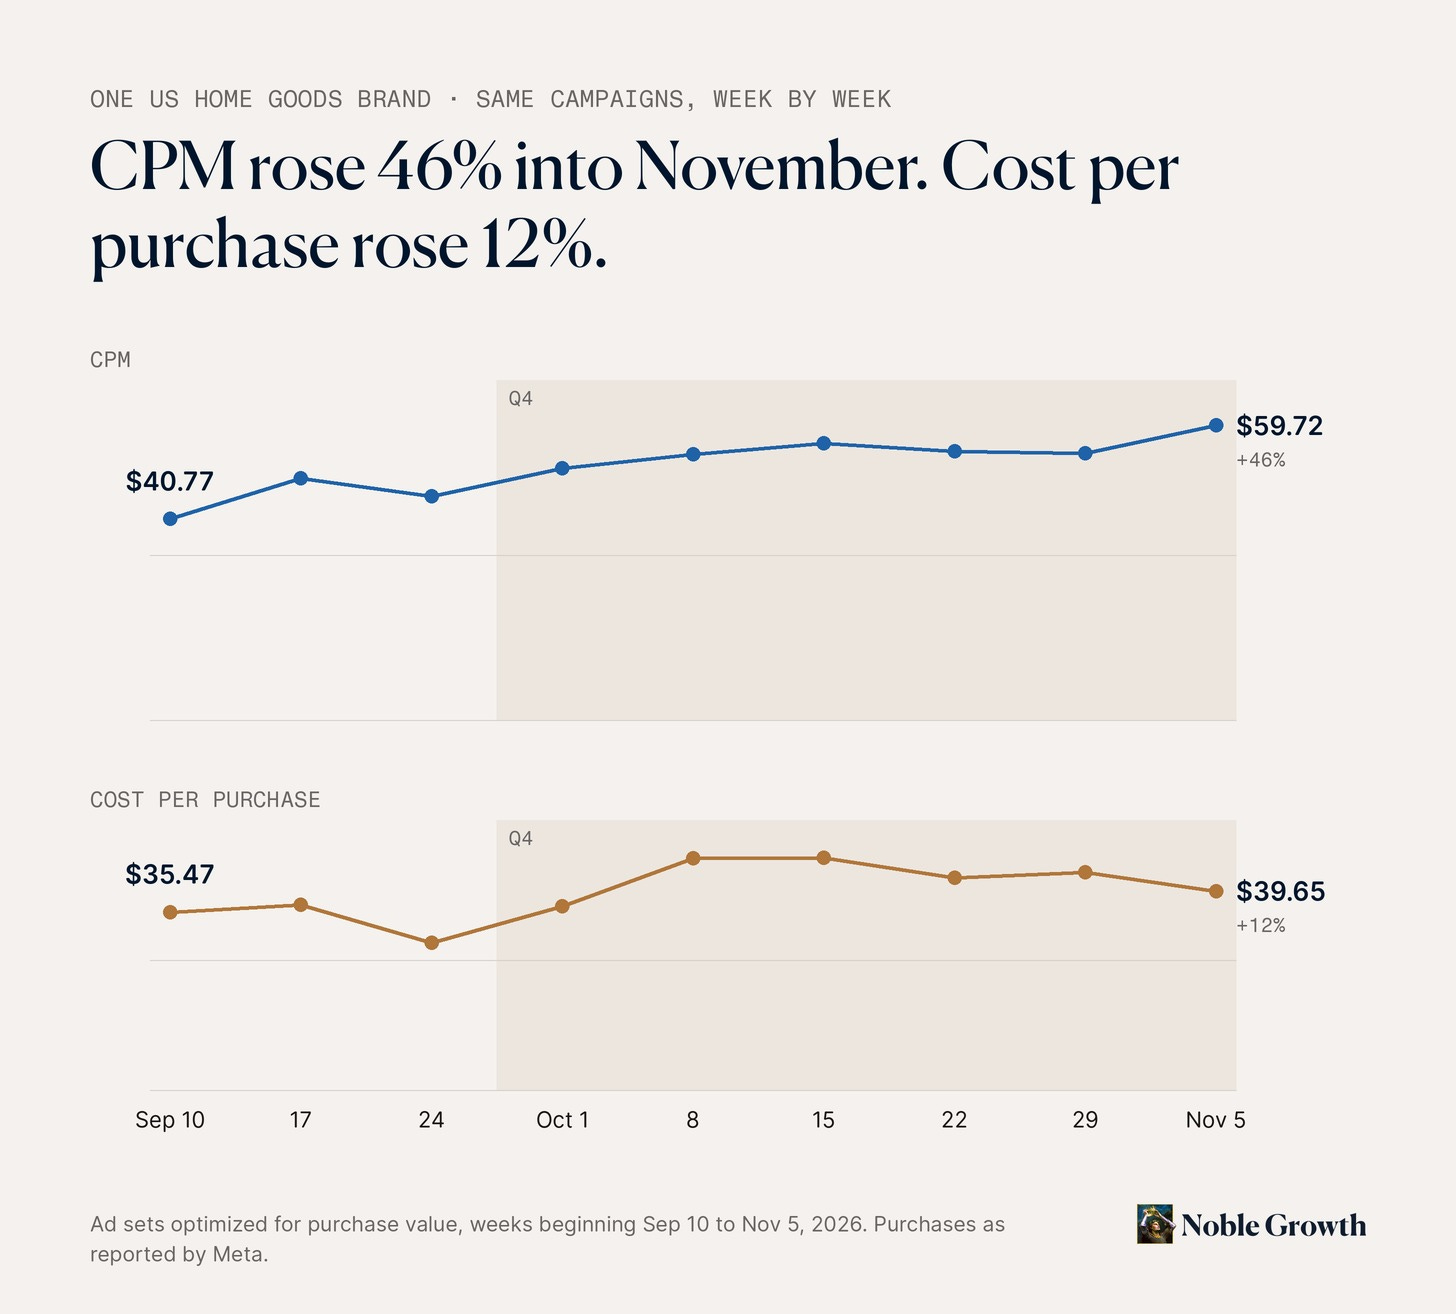
Test creative in summer, budget the fourth quarter at fourth-quarter prices, and expect costs to ease after the holidays.
Are Meta ads getting more expensive?
Yes. Meta reported a 14% year-over-year rise in its average price per ad in the third quarter of 2026. Our international account paid more in every month it advertised in both years; its October CPM rose 19%.
Why do Meta benchmarks disagree?
Against Triple Whale's median brand, our US purchase campaigns paid three times as much per thousand impressions and 17% more per purchase, and returned 2.5 times as much, because orders averaged $211 against $73. Benchmarks also differ because some count every click instead of link clicks, blend goals and countries, report the median account instead of pooled spend, or use different attribution. Ours are pooled, link-click, Meta-reported figures.
What is a viral post worth?
On November 5, a National Flag Foundation reel about a high school student told to take the American flag off his truck drew 5.2 million views in two days. At the $24.27 CPM our US e-commerce accounts paid this year, buying those views would cost about $126,600.
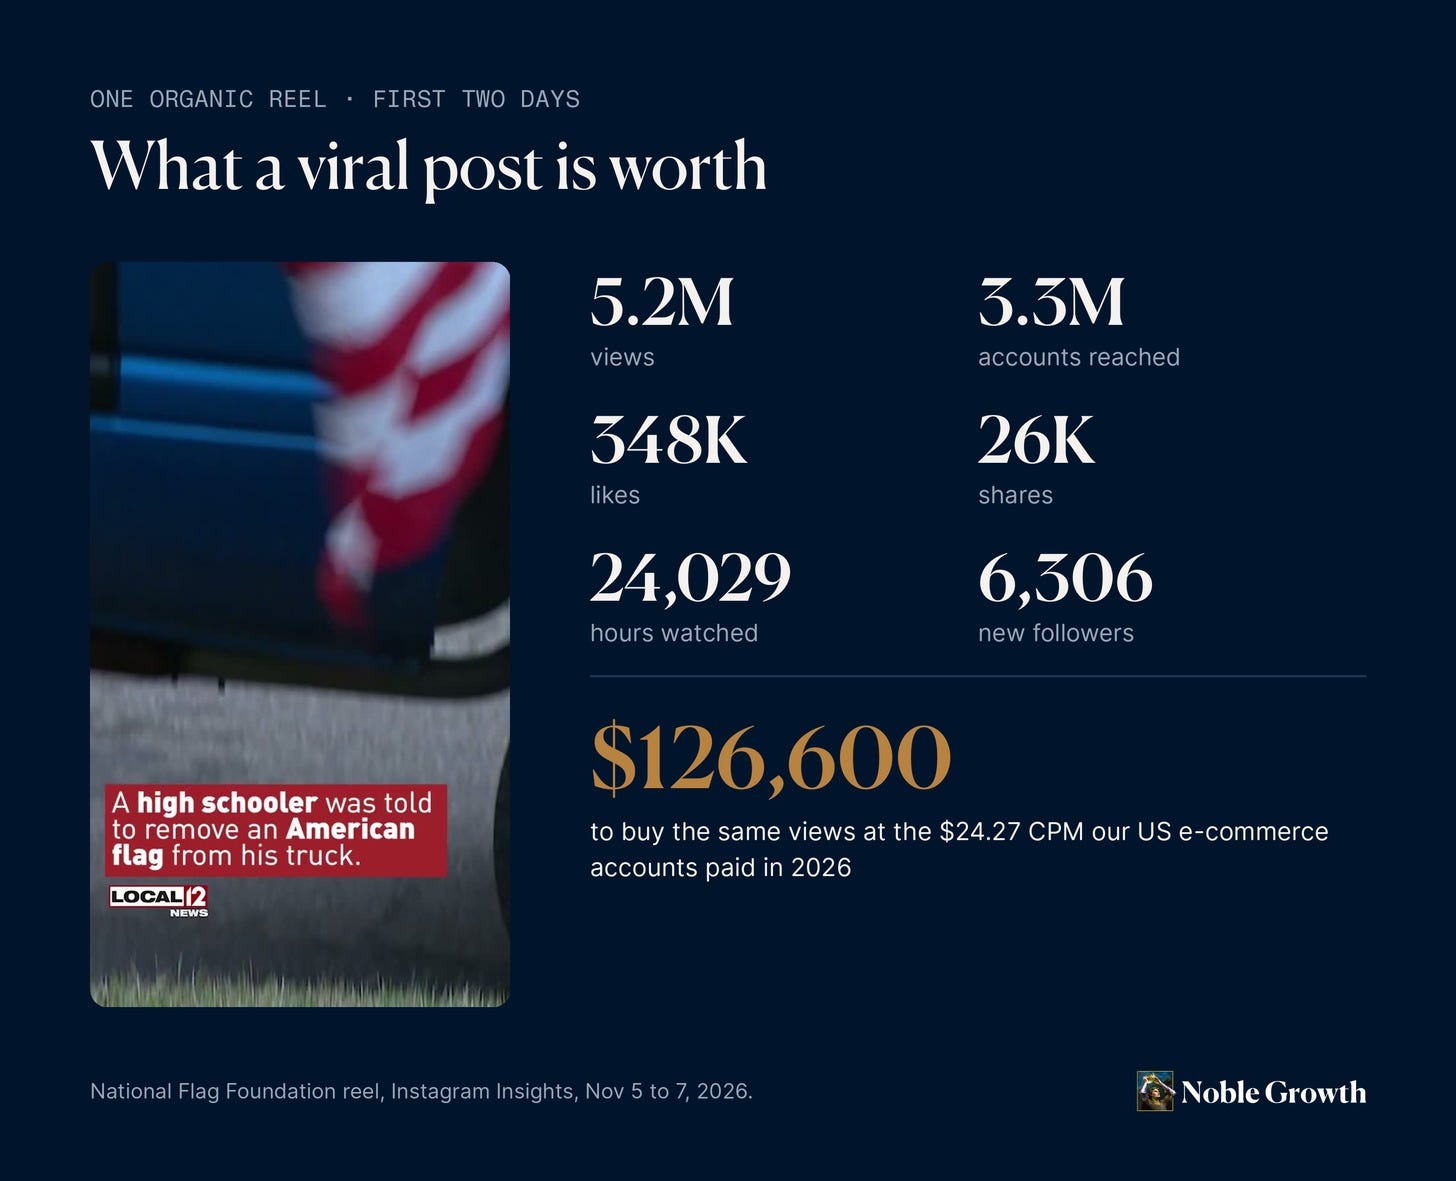
Organic reach buys attention: the same two days brought 10,672 profile visits and 33 taps on the website link. Ads can be pointed at the sale. The strongest accounts run both: organic finds the stories that land, and ads put the proven post in front of buyers. The account behind this reel grew from 124 followers to over 44,000 since we started.
How to use these benchmarks
A good ROAS is one above break-even: one divided by your contribution margin. The calculator in our benchmarks tool does the math.
Check Meta against your store every month. If Meta reports more purchases than your store took from every channel, the tracking is counting orders twice, and every return in Ads Manager is too good.
Optimize for purchase value, and judge every audience and placement by cost per purchase, never by CPM.
Test in summer, scale in the fall, and plan for most ads to lose.
About the data
Source: Meta's Marketing API, for every Meta ad account we manage that spent in 2026 except one small account on a separate reporting connection. January 1 to November 11, 2026, pulled November 12.
Costs (CPM, click-through rate, cost per click) cover each account's full year, including months before we managed it.
Sales, cost per purchase and return cover only the months we ran each e-commerce account, after we confirmed Meta's purchase count against store orders. Earlier months are left out because one account's tracking counted orders twice. The clicks-versus-purchases comparison uses two accounts' full year.
Our figures are pooled (total sales divided by total spend), as reported by Meta. Published panels report the median brand and use their own attribution. Non-USD spend is converted at fixed rates.
Published figures from Triple Whale, Databox, the agency panel and Meta were read at the linked sources on November 12. Reel figures are from Instagram Insights, November 5 to 7.
If you want your own account read against these numbers, book an intro call.
Below, in The Control Room: how to check Meta's purchase count against your store, what we found inside one account's cheap impressions before we took it over, full tables by goal, placement, age, device and gender, and the 20-minute routine we use to benchmark any Meta account.